Contact Center Rescue Series: P1 & P2 Analysis
The contact center is experiencing a high number of P1 and P2 tickets, which are classified as the most urgent and high-priority issues that require immediate attention. These tickets often involve critical system failures, major product defects, and other severe problems that can significantly impact the operation of the business and the satisfaction of customers.
As a result of this high volume of P1 and P2 tickets, the contact center is struggling to effectively prioritize and resolve these issues in a timely manner. This has led to increased pressure on the team, longer resolution times, and higher levels of customer frustration.
In order to address this problem, it will be necessary to identify the root causes of the high volume of P1 and P2 tickets and implement effective solutions to reduce the number of these high-priority issues. This will require collaboration across various teams and departments, including IT, product development, and customer service, in order to identify and implement the necessary changes.
When a service experiences an unplanned interruption or is experiencing degraded performance, an Incident is raised to remediate the service disruption. The response to the Incident is dependent on the Impact and Urgency of the incident. Every organization will build its own Impact and Urgency Matrix that will be used to specify the Priority of the Incident. This level of prioritization will determine the Response and Resolution times for the incident. For example, a Priority 1 incident could have a 15 mins response time and a 1 hour resolution time. Whereas a Priority 5 incident could have a 1 day response time and a 1 week resolution time.
Impact and Urgency Matrix from ServiceNow:
- Impact: Impact is a measure of the effect of an incident, problem, or change on business processes
- Urgency: Urgency is a measure of how long the resolution can be delayed until an incident, problem, or change has a significant business impact
- Priority: Priority is based on impact and urgency, and it identifies how quickly the service desk should address the task.

Sample Response and Resolve Targets from ProcessMaps:

The Objective of The Process:
The P1 & P2 Analysis process is focused on analyzing the P1 and P2 incidents and finding ways to either reduce them or respond and resolve them in a much quicker manner.
- Analyze the volume and type of P1 and P2 incidents and find ways to reduce them.
- For those P1 and P2 incidents that cannot be removed, find ways to respond and resolve them faster:
- Receive a P1 or P2 Incident via Service Desk, Other Support Group, Operations, Alert or Phone Call
- Identify And Log the P1 or P2 Incident, provide full details of issue description
- Classify And provide initial support
- Investigate And diagnose incident
- Resolve And Recover Service, provide full details of issue resolution
- Obtain Customer concurrence of issue resolution prior to closure of the incident.
- Provide Feedback to Service Desk on areas of improvement
- Working With Reporting and Measurements / Continual Improvement Coordinator to review and analyze Incident reports
- Partner With Quality Management Coordinator – Ticket Quality Management to review a random sample of Incidents and assess for quality.
- Work With Training Management Coordinator to address any skill gaps in Incident Handling
- Work With Knowledge Management Coordinator to create new or update existing knowledge base documents.
- Share Findings/observations with the Communications Coordinator via emails, newsletters for team meetings on trends and improvement areas.
Sample List of Benefits:
- Reduction in P1 and P2 incidents
- Improved Response and Restoration times
- Improved User productivity.
- Improved Customer and user satisfaction.
- Achievement Of SLAs.
- Process Adherence and control.
- Improved Usage of resources.
- Improved CMDB accuracy
Sample List of Observations:
- Gaps in the monitoring and alerting process are leading to a high volume of false alerts. This is overwhelming the teams and causing them to skip over potential P5, P4, and P3 alerts which end up becoming P1 and P2 outages.
- Lack of a Performance and Capacity Management process is leading to resource constraints during peak demand and resulting in outages.
- Lack of a Risk Management process is leading to inaction on End of Life (EOL) and End of Support (EOS) systems which are resulting in outages.
- Lack of a Firmware, Patch, and Currency Management process is leading to outages
- Lack of a Service Performance Management - Reporting and Measurements process is leading to a lack of awareness of the current environment. How things are tracking and trending.
- Lack of a Service Performance Management - Analytics and Optimization process is leading to missed insights from the current volume of P1 and P2 outages and what actions could be taken.
- Lack of a Continual Service Improvement Management process is leading to minimal or zero improvements in the environment.
Sample List of Recommendations:
- Implement a monitoring and alerting process that is monitoring all CIs and has correct threshold settings. Ensure Event Management teams are actively monitoring all alerts.
- Implement a Performance and Capacity Management process that takes into account Demand Management and Workload Dynamics to ensure the availability of resources when they are needed.
- Implement a Risk Management process that proactively identifies risks in the environment and ensures action is being taken to remove the risks.
- Implement a Firmware, Patch, and Currency Management process to avoid exposures.
- Implement a Service Performance Management - Reporting and Measurements process to proactively track and trend P1 and P2 outages.
- Implement a Service Performance Management - Analytics and Optimization process to proactively harvest insights from P1 and P2 outage data.
- Implement a Continual Service Improvement Management process to collect, track and implement all improvement recommendations.
Sample List of Areas to Probe:
- Conduct separate analysis for P1-Alerts, P1-User Reported, P2-Alerts, and P2-User Reported
- Compare current week to previous week and calculate % increase or decrease.
- Anything above +/- 5% explain the variance.
- Compare the Top 10 Affected Users for current week to previous week and see if there are any significant changes. Look at Short Description field to get details on types of issues.
- Compare the Top 10 Business Functional Units for current week to previous week and see if there are any significant changes. Look at Short Description field to get details on types of issues.
- Compare the Top 10 Organization for current week to previous week and see if there are any significant changes. Look at Short Description field to get details on types of issues.
- Compare the Top 10 Location/City/Country for current week to previous week and see if there are any significant changes. Look at Short Description field to get details on types of issues.
- Compare the Top 10 Assignment Groups for current week to previous week and see if there are any significant changes. Look at Short Description field to get details on types of issues.
- Compare the Top 10 Category/Subcategory for current week to previous week and see if there are any significant changes. Look at Short Description field to get details on types of issues.
- Compare the Top 10 Configuration Item for current week to previous week and see if there are any significant changes. Look at Short Description field to get details on types of issues.
- For each of the Top areas, Slice n Dice further to gain additional insights. For example, if you have identified a chronic server, build Time Series PBAs to see if you can detect any patterns. Build Pareto, Matrix, and Compare views to see if you can make any correlations to other variables. i.e. Server X By Priority, Server X by Category/Subcategory, Server X by Short Description, etc.
- Conduct volumetric analysis to identify if there are any emerging patterns. Look at time series PBA views across Year/Quarter/Month/Week/Day/Hour
- Are data points increasing, decreasing, staying flat?
- Are there any seasonal patterns or cyclical behaviour?
- Are there any random/non-random behaviours?
- Are there any exceptions above or below the control limits?
- Are there 8 reporting periods above or below the average?
- Are there 6 consecutive reporting periods increasing or decreasing?
- Is there any gradual trend emerging?
- Is the increase or decrease related to alerts or user-reported volumes
- Are there any repeat/chronic issues? (Servers, Storage, Network, Application, Databases, Middleware)
- Are failed/unauthorized/expedited/emergency changes causing issues?
- Is the release/deployment process causing issues?
- Is the performance and capacity management process causing issues? Disk Space, CPU, Memory, etc.
- Is a lack of monitoring and alerting / event management contributing to issues? Increase in alert volume due to poorly set thresholds, servers not being turned off during maintenance windows, etc.?
- Is a lack of firmware/patch/currency management contributing to incidents? EOL systems, Unsupported systems and applications?
- Are Resolve times being impacted due to backup and recovery issues? Backups not available?
- Are the issues related to Infrastructure or Applications? (Application, Middleware, Database, Server, Storage, Network).
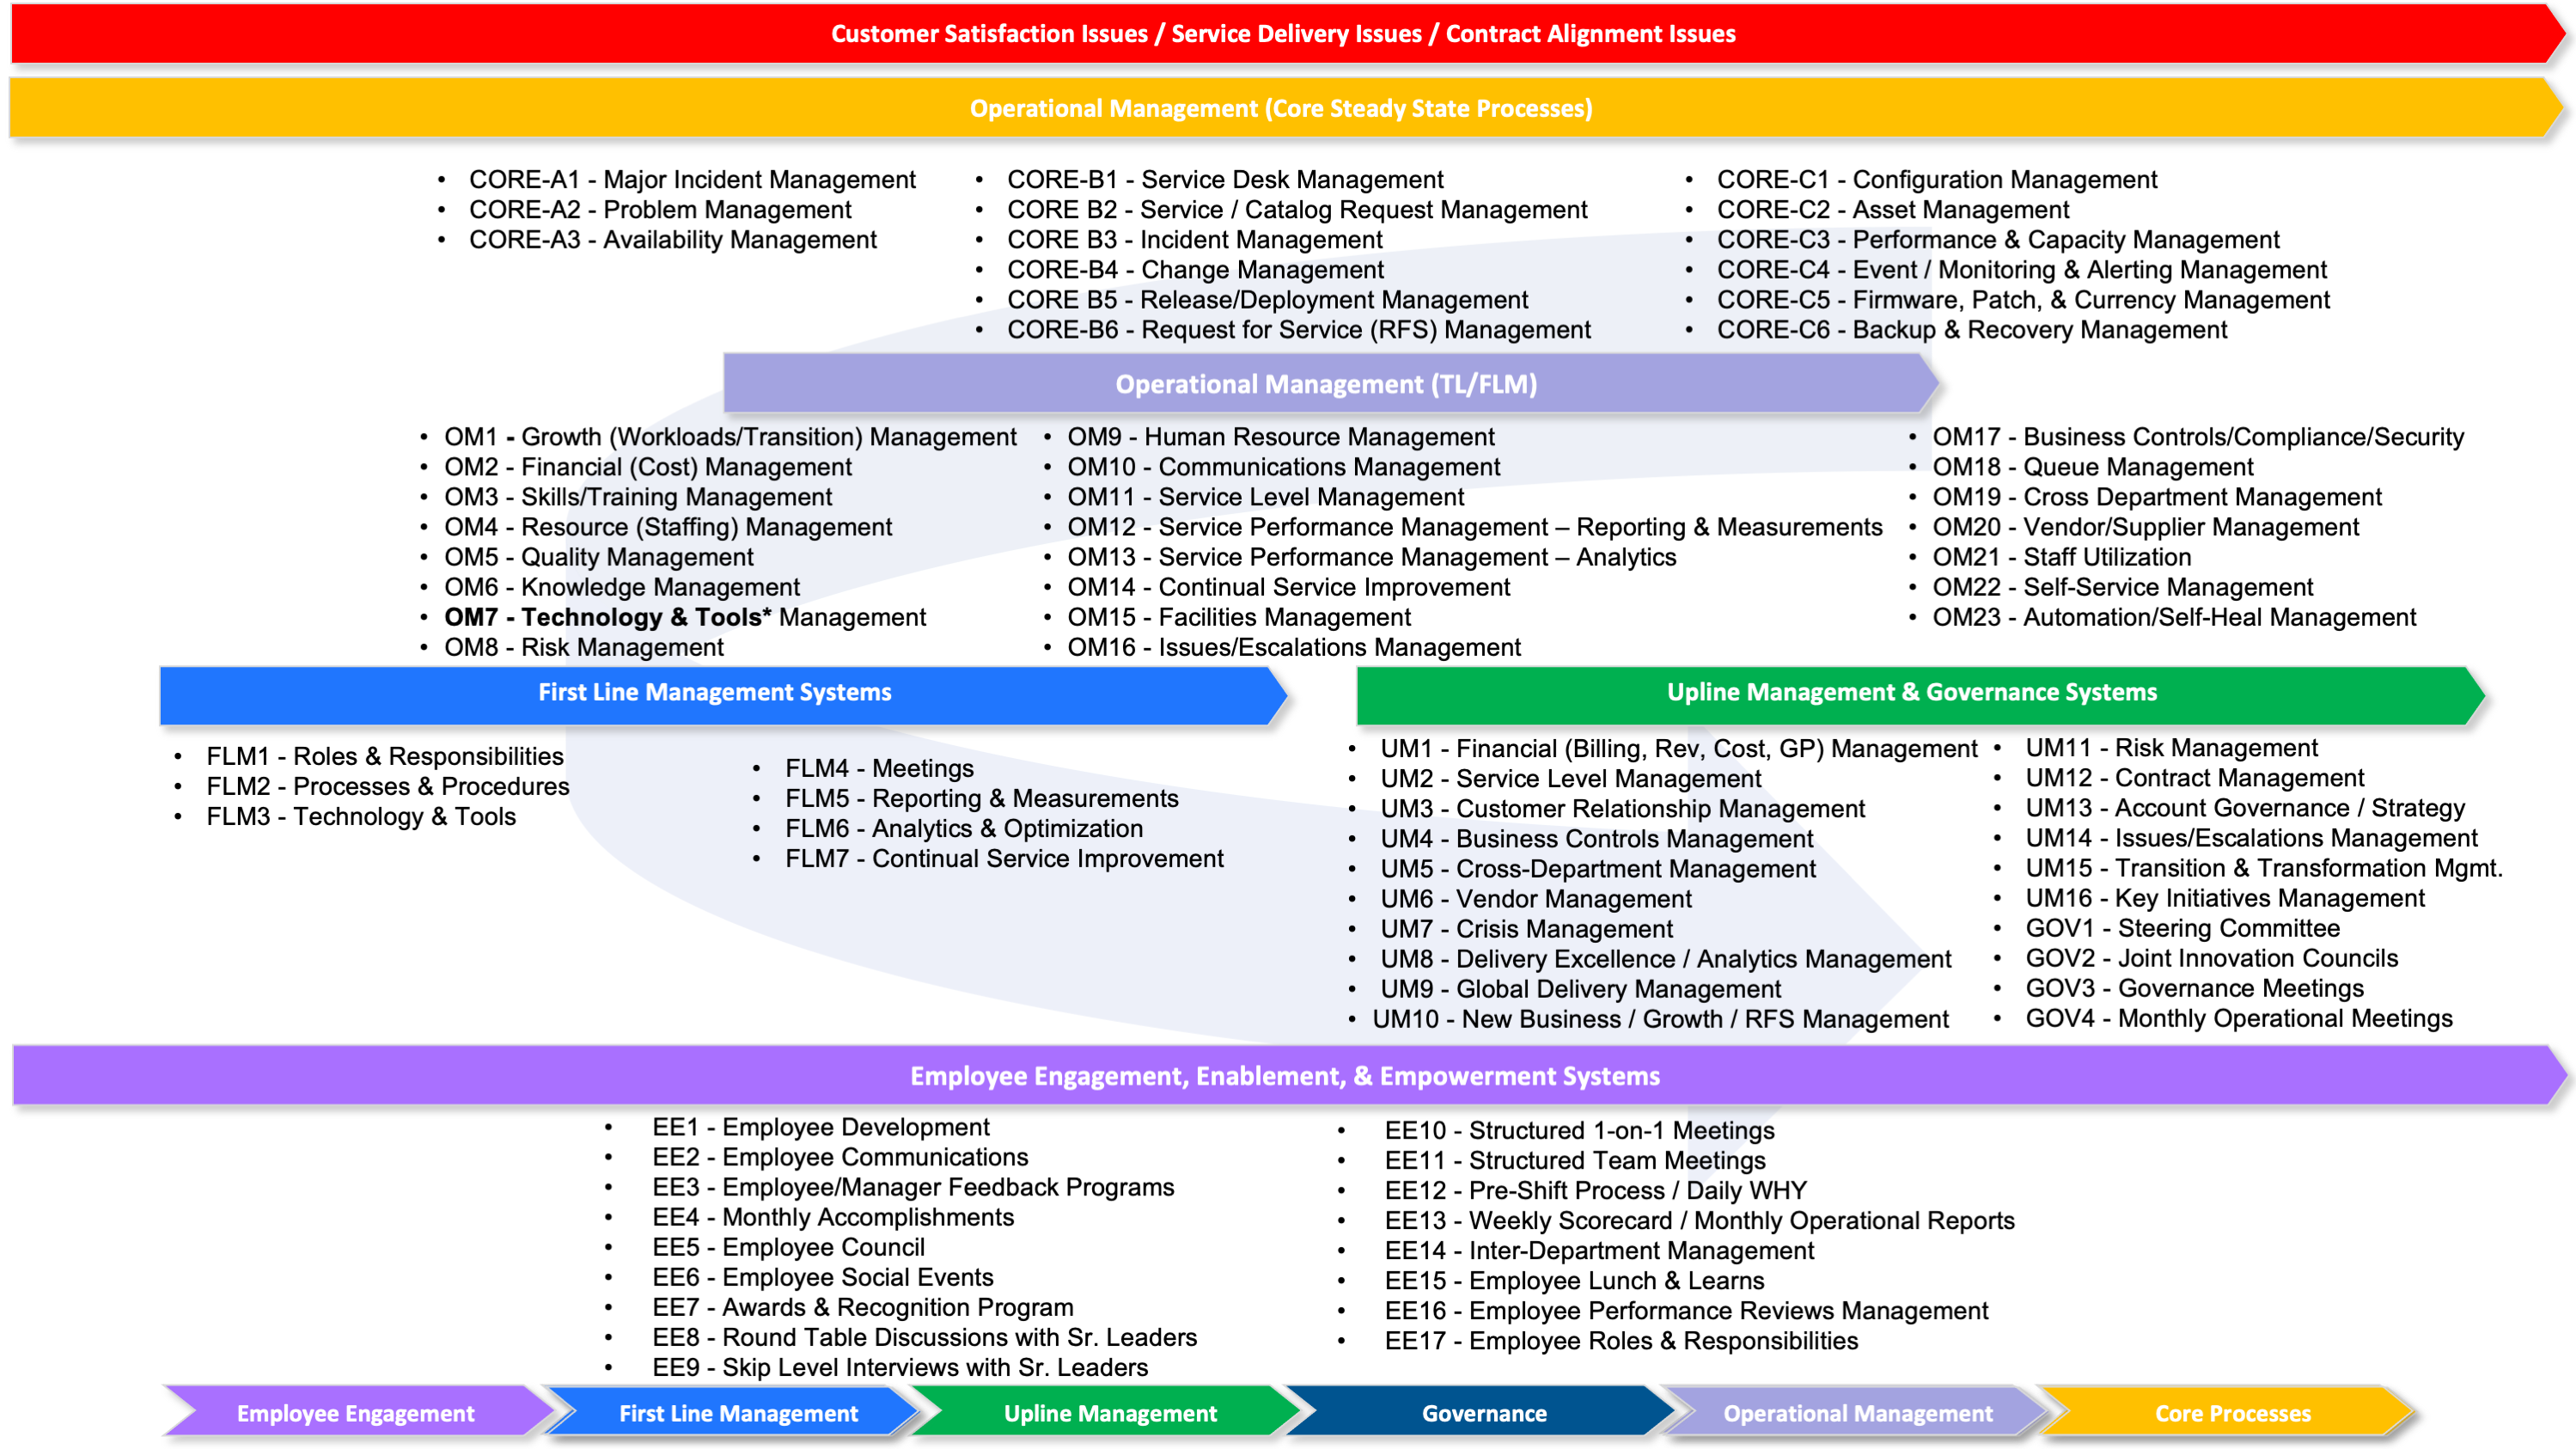
Exercise: What elements of the Operational Management Framework do you think have an impact on P1 and P2 Volumes?

Subscribe To My Blog To Learn More: https://www.imadlodhi.com/subscribe


