Contact Center Rescue Series: Cost per Ticket - The Metric that Measures the Success of Your Service Desk
The cost per ticket in the contact center is having a significant impact on the overall budget and profitability of the company.
The high cost per ticket is causing financial strain on the company, potentially leading to decreased profits and even financial losses. This can result in difficult decisions such as layoffs or budget cuts in other areas of the business. In addition, the high cost per ticket may make it difficult for the company to compete with other businesses in the market.
Some potential solutions to this problem may include implementing more efficient processes, automating certain tasks, and investing in better technology. These solutions have the potential to reduce the cost per ticket and improve the financial performance of the company. However, it is important to carefully evaluate the trade-offs and potential consequences of these solutions, as they may also have an impact on the quality of service provided to customers. It may also be helpful to consider additional strategies such as training and development for customer service agents to improve their efficiency and productivity.
Do you know how much it costs to support your customers? Surprisingly, many service and support managers don't have a good handle on their Cost per Ticket. This is the total monthly operating expense of a service desk divided by the monthly ticket volume. Without this information, it's difficult to measure the success of your service desk - or determine where you need to make improvements.
In this blog post, we'll discuss what Cost per Ticket is and how you can use it to measure the effectiveness of your service desk.
Service desks need to be aware of the cost per ticket so they can track and trend it. If customer satisfaction goes up, then that could mean lower costs for service providers because their efficiency increased with higher quality work done in less time frame than before; but if there is no improvement or even decreases when compared to previous months' data collection - this may indicate something wrong since typically rates should increase over time as more customers go through various stages on any given project (from initial contact all way until closure).
Let's first understand the Cost Per Ticket Metric. This is a straightforward calculation where you divide the Total Monthly Operating Expenses (Labour and Non-Labour) by the Total Number of Tickets.
If you, for example, process more tickets within the same costs, then your cost per ticket will be lower. Imagine your monthly operating cost is $2M for 25 Agents at a fully burdened cost of $80K/year and you process 20K tickets. At this rate, your cost per ticket will be $2M/20K = $$100. However, if you increase utilization, by decreasing average handle times, minimizing schedule adherence issues, improving FCR, etc., then you might be able to increase your processing rate to 25K. Which would mean that $2M/25K = $80.
Organizations aiming to decrease their cost per ticket have several options available to them. One is to choose to increase agent utilization, either by increasing Work Produced (number of minutes spent on productive activities) or by reducing Work Capacity (total number of minutes available in the day).
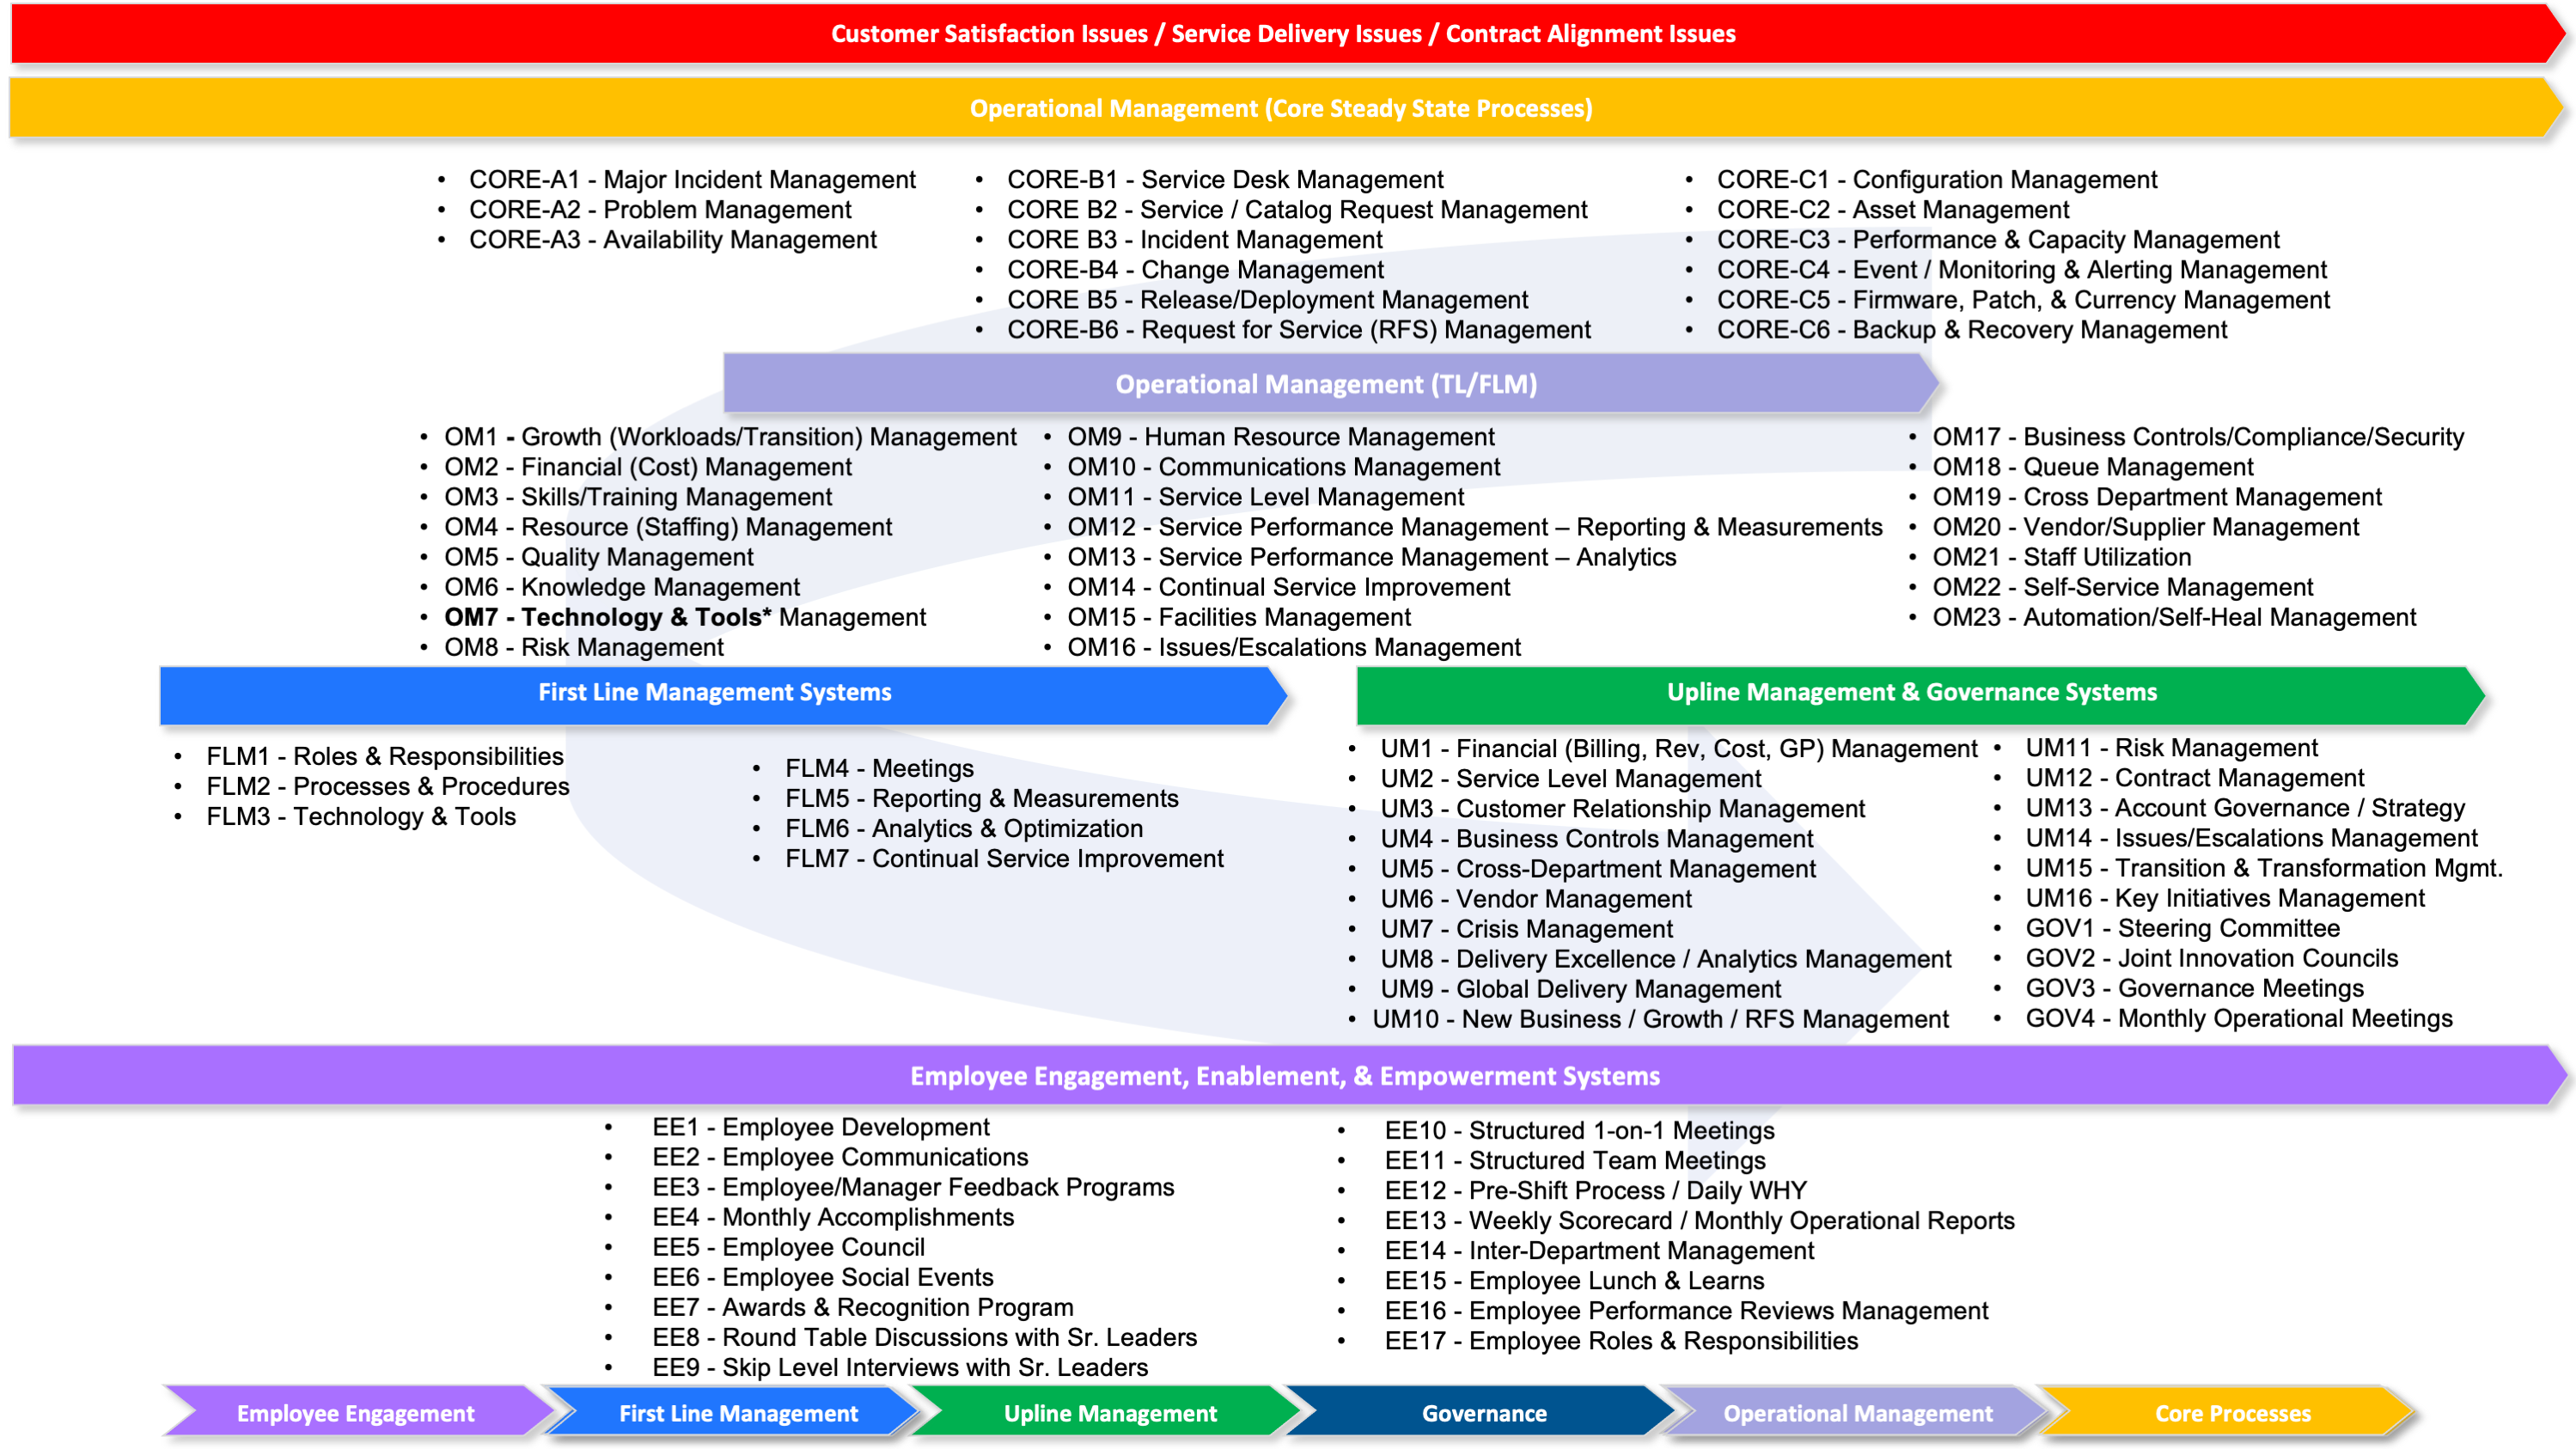
There are a few different ways to reduce your Cost per Ticket, for that, we will once again refer to our Operational Management Reference Framework.
The Objective of The Process:
The Objective of the Cost Per ticket process is to ensure service desk efficiency is at the expected levels. The process focuses on analyzing Cost per Ticket on a monthly basis and tracking it over time to determine if higher satisfaction levels are being achieved with lower costs, or vice versa.
Sample List of Benefits:
- Improved utilization, which refers to the percentage of time agents are actively working on tasks versus being idle. By improving your utilization, you can reduce the number of agents needed to support your customer base.
- Reduced Call Handle Times
- Improved SLAs
- Improved Staffing Levels
- Better Managed Workloads
- Improved FCR rates
Sample List of Observations:
- Poor utilization rates
- High Call Handle Times
- Aggressive SLAs
- Poor Schedule Adherence issues
- Ineffective Staffing Levels
- Unmanaged workloads
- Poor First Call Resolution Rates
Sample List of Recommendations:
- OM1 Growth (Workloads) Management - Understand the workload dynamics and staff accordingly. Look for ways to reduce workloads so less staff are required.
- OM3 - Skills/Training Management - Improve skills and training so productivity increases resulting in an increase in utilization and a decrease in staff requirement.
- OM4 - Resource (Staffing) Management - Ensure workforce management teams are using the workloads, SLAs, AHT and other factors to appropriately set the staffing levels.
- OM5 - Quality Management - Ensure that the Total Quality Management team is reviewing all contacts to identify areas to improve efficiency. Higher efficiency/productivity will lead to increased utilization and a decrease in additional staffing requirements.
- OM6 - Knowledge Management - Ensure that the Total Quality Management team is reviewing all contacts to identify areas to improve efficiency. Higher efficiency/productivity will lead to increased utilization and a decrease in additional staffing requirements.
- OM7 - Technology & Tools Management - Ensure the Agents have the necessary technology and tools such as a robust ticketing system with workflows, VPN, Remote Takeover, etc to process the calls in a more efficient manner.
- OM11 - Service Level Management - Ensure the right service levels are selected. Aggressive service levels will require additional staff and as a result, costs will increase.
- OM12 - Service Performance Management - Reporting & Measurements - Ensure you have the reports and measurements to track and trend performance and identify how to improve utilization and reduce costs.
- OM13 - Service Performance Management - Analytics & Optimization - Ensure you have an analytics & optimization program in place to harvest insights from agent performance and identify how to improve utilization and reduce costs.
- OM14 - Continual Service Improvement - Ensure you have a continual improvement process in place where the opportunities that have been identified to drive improvement are managed to implementation.
- OM18 - Queue Management - Ensure you have queue management in place to drive work building up in the queues. By addressing the work in a timely manner, utilization will increase.
- OM21 - Staff Utilization -Improve your utilization, which refers to the percentage of time agents are actively working on tasks versus being idle. By improving your utilization, you can reduce the number of agents needed to support your customer base.
- OM22 - Self-Service Management - Ensure you have a self-service channel to redirect calls from the service desk to the self-help portal. This will reduce the service desk labour costs.
- OM23 - Automation/Self-Heal Management - Implement Self-Service, Automation and Chatbot channels to redirect calls from the Service Desk Agents and towards less costly channels.
If you're not already tracking your Cost per Ticket, now is the time to start. This metric will give you a good indication of how well your service desk is performing.
If you're not sure where to start, try tracking your Cost per Ticket for a few months and see where you can make improvements. By reducing your Cost per Ticket, you'll be able to measure the success of your contact center more effectively and ensure that you're providing the best possible support to your customers.
Contact centers that don't have a handle on their Cost per Ticket are missing out on an important metric. Service and support managers need to know their Cost per Ticket in order to measure the success of their contact center.
Exercise: What elements of the Operational Management Framework do you think have an impact on Cost Per Ticket?
Subscribe To My Blog To Learn More: https://www.imadlodhi.com/subscribe
Loved it? Follow me.


