Contact Center Rescue Series: Analytics And Optimization
The lack of an effective analytics and optimization system in the contact center is causing several problems for the organization, including difficulty in tracking and analyzing the performance of customer service agents, lack of visibility into customer interactions, and difficulty in identifying trends and patterns in customer behavior.
These problems can lead to a number of negative consequences for the organization, such as decreased customer satisfaction, reduced efficiency and productivity, and missed opportunities for business growth.
Implementing an analytics and optimization system in the contact center can help to address these problems and address the negative consequences. This system should provide the necessary insights and tools to track and analyze the performance of customer service agents, understand customer needs and preferences, and identify trends and patterns in customer behavior. By addressing the lack of an effective analytics and optimization system, the organization can improve the customer experience, increase efficiency and productivity, and drive business success.
Analytics and optimization processes are important in the contact center because they help to identify and analyze data and trends, and then use this information to make informed decisions and implement strategies to improve the performance and efficiency of the contact center. By analyzing data on customer behavior, agent performance, and other key metrics, contact center managers can identify opportunities for improvement and develop targeted strategies to address any issues or challenges. Additionally, optimization processes can help to ensure that the contact center is operating at peak efficiency, by analyzing and adjusting factors such as staffing levels, call routing, and the use of technology. Overall, analytics and optimization processes are essential for the success and sustainability of a contact center.
If you're a contact center manager, then you know that analytics and optimization processes are essential for the success of your operation. But what exactly do these processes entail? And how can they help to improve the performance of your contact center? In this blog post, we'll take a closer look at what analytics and optimization processes are, and how they can benefit your contact center. So read on to learn more!
In this blog, we will discuss the following:
1. The importance of analytics and optimization processes in the contact center
2. How analytics and optimization processes can help to improve the performance and efficiency of the contact center
3. The benefits of using analytics and optimization processes to ensure that the contact center is operating at peak efficiency
4. The impact that analytics and optimization processes can have on the overall success of a contact center
The importance of analytics and optimization processes in the contact center
Analyzing customer interaction data and optimizing workflows are a crucial part of operating a successful contact center. By leveraging the insights from such data, contact centers can ensure optimal speed and quality of customer service delivery, leading to happier customers and less operational costs. Analytics can also be used to predict customer needs based on previous interactions and help to improve operational efficiency. Optimization processes are also important to contact centers as they help to generate better outcomes in specific areas like staffing or performance management strategies. In conclusion, having robust analytics and optimization processes in place is essential for any contact center that wants to maximize customer service levels and create more efficient operations.
How analytics and optimization processes can help to improve the performance and efficiency of the contact center
Organizations are increasingly leveraging data-driven insights, analytics and optimization processes to improve their contact center performance and efficiency. Specialized software solutions can be used to streamline the contact center process. This can include analyzing customer service requests, agent interactions, customer preferences or product sales - all of which help to identify areas in need of improvement. The aggregated data is then used to refine existing processes for better accuracy and success. By creating automated workflows that mitigate manual labor, organizations can ensure that agents are utilizing their resources and support customers more effectively. Ultimately, this maximizes job effectiveness, improves customer satisfaction, and reduces costs incurred by contact centers over time.
The benefits of using analytics and optimization processes to ensure that the contact center is operating at peak efficiency
Utilizing analytics and optimization processes can be a significant boon for customer service contact centers. From automating customer issues or fraud detection to improvement in customer satisfaction, the utilization of analytics allows contact centers to efficiently identify areas where performance could use improvement. This also enables managers to better respond to changes in customer behavior as well as providing them with quality data insights they can take action on. Overall, investing in the implementation of analytics and optimization processes can provide immense value; an efficient and effective contact center creates a more satisfying experience for customers and leads to lower costs, higher revenues, stronger brand loyalty, and increased profits.
The impact that analytics and optimization processes can have on the overall success of a contact center
Contact centers can significantly benefit from employing analytics and optimization processes. By leveraging data to make smarter decisions, contact centers can reduce operational costs while still providing quality service to customers. With AI-based automatic call distribution (ACD) strategies, contact centers can improve workflow efficiency and provide faster response times to customer inquiries. This leads to happier customers and heightened customer loyalty; Customers also appreciate being able to connect directly with an expert who has insights into their specific situation. These advanced analytics and optimization processes allow for tangible benefits that enable a contact center's long-term success.
The contact center is a critical part of any business and the success or failure of the contact center can significantly impact the company's overall success. This is why it is important to use analytics and optimization processes to ensure that the contact center is running at peak efficiency. By using these processes, businesses can improve performance and increase customer satisfaction. Additionally, using analytics and optimization processes can help businesses identify areas where they need to make changes in order to improve their contact center operations. Ultimately, this will lead to a more successful contact center and a more successful company. Are you looking for ways to optimize your contact center? Subscribe to our blog for more tips!
The Analytics & Optimization process harvests various datasets to gain insights into the historical performance of the area being reviewed. The insights are used to develop foresight about how to reshape the go-forward strategy to drive operational improvements.
As the amount of collected data increases, so do the number of reports and associated metrics. However, as the focus shifts to gathering and presenting the data, many organizations fail to analyze the data to extract insights.
As organizations embark on the analytics journey, they make substantial investments in tools, particularly cognitive tools, resources, and mobilization of great effort internally, such as daily/weekly/monthly meetings, generation of reports, and the creation of squads/taskforce. However, they realize that while they can report on the effort, the results are less than desirable.
Analytics is not about the tools, charts, or effort. It is about a mindset. The curiosity of the mind. The approach to looking at something and asking why.


The Objective of the process:
The objective of the Analytics and Optimization process is to ensure that data being collected is harvested to gain insights using a structured approach. The insights are used to optimize the operational management system to drive improvements.
Sample List of Benefits:
- Improved quality of the Incidents
- Overall reduction in Incidents
- Reduced false alerts
- Improvement in Change Success Rate
- Improvement in SLAs
- Improvement in Repeat issues
- Improvement in Mis-Routed tickets
- Improvement in Re-Opened tickets
- Reduction and better management of Backlog
- Improved Uptime and Availability of Applications and Infrastructure
- Identification of Automation, Self-Help, and Self-Healing opportunities
- Establishment of a Shift-Left Strategy
- Improved management of Problem Tickets
- Improved quality of RCA documents
- Improved Major Incident Handling
- Improved Training
Sample list of observations:
Collection and presentation of data via reports, but no analytics performed on the data.
- Analytics program not established.
- Roles and responsibilities, processes, tools, meetings not established.
- Training not provided to conducted analytics in a structured manner.
- Analytics program not structured.
Sample list of recommendations:
Ensure the collection of data is clearly defined. How is the data collected, what is the criteria, who collects it, how is it collected, where is it stored, etc.
- Provide training to identified resources.
- Provide processes and procedures on how to run the analytics program.
- Provide tools to conduct analytics
- Set up meetings to manage the process
- Create reports to review the analytics outputs
- Share the insights with the broader teams
Assessment Questions:
- What are the top ticket drivers?
- What is the time series PBA Volume view of the tickets – Year/Month/Week/Day/Hour?
- What is the time series PBA MTTR view of the tickets – Year/Month/Week/Day/Hour
- Are there any observable SPC patterns in the MTTR data?
- Are high MTTR times due to agent, requestor, KB, etc. issues
- Are high MTTR times related to same call driver? same agent? same requestor
- What Users/Country/Department are generating the tickets
- Who is resolving these tickets (Resolver Name/Group)
- What is the priority of these tickets
- How were the tickets generated (Email, Phone, Chat, Web, Fax)?
- What is the status of the tickets
- How long are the open tickets aging?
- Are they repeat tickets for the same issue (Agents not resolving or HW/SW/NW Bugs)?
- Does MTTR vary between Agents, Time of Day/Week/Month, Application, Region, Business Unit, etc. Are there any observable SPC patterns in the MTTR data?
- Does quality of the documentation vary between Agents, Time of Day/Week/Month, etc.
- Do the negative CSAT surveys map to Agents, Time of Day/Week/Month, Application, Resolver Group, Business Unit, Country, etc.
- Is any training to the agents or requestors needed based on quality of the tickets, MTTR reviews, Resolution Codes, and L2 groups tickets are sent to?
- Is any update to the KB documentation needed based on quality of the tickets, MTTR reviews, Resolution Codes, and L2 groups tickets are sent to?
- Does the Self-Help Portal need to be updated based on quality of the tickets, MTTR reviews, Resolution Codes, and L2 groups tickets are sent to?
- Do we need to distribute e-newsletters, FAQs, have DSUG meetings based on quality of the tickets, MTTR reviews, Resolution Codes, and L2 groups tickets are sent to?
- Are Tickets being flagged in a way to exclude them from SLA calculations and CSAT surveys
- Are Agents prolonging tickets at certain periods of the day to avoid taking additional calls
- Are Agents offloading tickets at certain periods of the day (Breaks, Lunches, Dinner, Shift End)
- How is the case to call ratio?
- Is ticket documentation quality varying based on agents, time of day, etc.?
- Are Agents closing tickets prematurely to inflate FCR?
- Are Agents referring higher amount of tickets at certain times of the day?
- Are Customers requesting L1.5/DSS teams versus working with SD?
- Are repeat calls confined to a certain group of agents?
- Were the Business requirements not clear for the implementation which ultimately led to an outage immediately after implementation of shortly afterwards (i.e. a few business days in or week etc.)
- Were the Business requirements clear though not implemented properly? What was the cause (procedural, tools, human error etc.)?
- Did we make changes without consulting with the business for any incidents?
- Are the incidents (or what percentage of them) as a result of failed Technical or Business PIV or both?
- Was there PIV performed by both areas after implementation? If not, why (i.e. not required, oversight, Business not available, Technical resource shortages etc.)
- How many incidents were related to the TEST/UAT environment not being like for like Production thus incomplete testing?
- Is the ratio of incidents in Application or support Infrastructure suite higher than the other LOB applications?
- Is the largest percentage of Application outages isolated to a finite group of? If so, what is that telling us?
- Is the ratio of Changes larger against a specific set of Applications/Infrastructure versus the remainder of Applications? Why?
- Is the ratio of Applications being downgraded in Priority levels as a result of incorrect batch flow automation or human error when creating the ticket? What ratio of each type?
- Is it the same suite of Applications being incorrectly categorized with respect to the priority being downgraded?
- Are there any incidents being reported under different Priority ratings (i.e. similar impact though reported as P1, P2, P3, P4 at different times) thus not consistent?
- How many incidents are related to changes that were implemented to correct other errors?
- How many changes have been implemented to correct improperly applied changes?
- How many and which Applications/Infrastructure have a higher ratio of incidents related to Single Points of Failure, Technology Currency, Patching and/or Resiliency exposures?
- Do we have a proportionate number of incidents related to Software versus Hardware issues?
- Can we ascertain how many incidents are repeats and/or could have been avoided if we properly executed on the Problem Management Process to determine & execute on Root Cause/Avoidance at the first incident?
- For the incidents identified as repeat was the problem management process performed with the first incident or not and why?
- If the PM process was executed & RCA clearly identified why were we not able to avert the subsequent outage?
- How long after a Change has been implemented did we suffer the first outage (i.e. when a new feature is first utilized etc.)
- What are the common incident outage themes (i.e. People, Process, Documentation, Technical, Tools) across both Application/Infrastructure?
- On the Infrastructure side can we ascertain outage ratios against Database-Middleware, Mainframe, Mid-Range, Windows, Virtual, Network, Storage, Unix etc. to strike a theme? We can then dig further into this output.
- For incidents – how many do we learn from the client (i.e. to Service Desk) first before we know and can react on the Application-Infrastructure side via alerting/monitoring?
- What is the normal time gap as this occurs?
- Where can we implement synthetic testing of application functionality or transactions to simulate a flow and put up an alert if a certain condition is met before a client calls (i.e. similar to some Online Banking test scripts)?
- For alerting/monitoring – if we have a reaction time gap is this because of short staff on the Application/Infrastructure side to deal with the volume?
- For alerting/monitoring – if we have a reaction time gap could it be because we are reliant on a non-Command Centre 7/24 structure (eyes on glass) or Follow the Sun Model to react real time as opposed to the alert being sent to a L2/L3 support person that is offsite and the support person needs to login in to validate the error, then take action resulting in delays?
- For alerting/monitoring – are we seeing a negative trend with either Infrastructure versus Application alerting & reaction times?
- How many incidents do not have alerting/monitoring defined due to oversight or because we cannot monitor a service, function, alert etc.
- What is the average time lag between an Alert->Business Impact->Incident Ticket Open-Resolved-Closed-MTTR-Problem Ticket Open/Close
- What are the trend Root Cause Codes (Infrastructure/Application)?
- What is the time delay to Root Cause identification for Application/Infrastructure/3rd Party-Vendor?
- Are the Incident trends more prevalent during the Monday-Friday time period versus Saturday-Sunday?
- Are the Incident trends more prevalent during the 8AM-4PM, 4PM-Midnight, Midnight to 08:00AM time periods on either Monday-Friday versus Saturday-Sunday?
- Are the Incident trends more prevalent during the Month End, First Business Day, Mid-Month, Quarter End time frames?
- Are the incident trends more prevalent during short staffing periods or compressed timelines for projects/processing times etc. thus resulting in a higher ratio of incidents (i.e. Rushed Work is not Quality Work)?
- As per industry trend are we worse than, equal to or better than a potential peer group (i.e. another FI or otherwise)?
- What is the competition doing that we are not if our Application/Infrastructure architecture-configuration, size, interfaces and dependencies are equal and we have a higher ratio of outages?
- How much data or tickets did we discard during this exercise? Was it material that could have altered the outcome of this report?
- Did you surface trends by users/groups?
- The automated alerting which was reported –was it more prevalent in one Application or portfolio of applications?
- Were there specific trends on a day of the week?
- Do we have more details on repeat trends?
- Were you able to report on trends relative to alert/outage/ticket open-response times and the gaps within?
- We need to create a Service Management road show which includes a Service Desk/Application support Incident engagement flow in order to educate the field. We have done something like this with the other Service desks.
- Are tickets being addressed at the appropriate layers (Service Desk, Tier2, Management etc.)
- Proactive Trend Analysis needs to be done consistently at the Application level. How will this be introduced?
- Are the trends/spikes in line with the interfacing apps which feed the highlight applications in this report?
- Alert Settings –Are the Performance & Capacity Management settings being reviewed with the Application space with respect to Trends/Insights?
- Do we have more details around Change Related Event-Incident Trends?
- Do you have more details around Vendor related incidents to extract trends?
- How can we expand on the inbound quality issues (i.e. feeder applications)?
- What are we learning or missing in the P3-P4 trends?
- Why are certain Service Request volumes higher across the portfolio of applications?
- Did we see behaviors across the Applications that are consistent within a specific dept?
- There was a higher # of alerts. Do we know how?
- Did we extract any Infrastructure related Alert-Incident data to match the themes as part of the overall exercise?
- Are there recommendations in here that support the establishment of an Application Command Centre Model (i.e. 7/24 eyes on glass support)?
- Who is receiving reporting on these negative trends or address tickets in their queues?
- Who will review the Alert to Incident variables to ensure a sanity check has been done
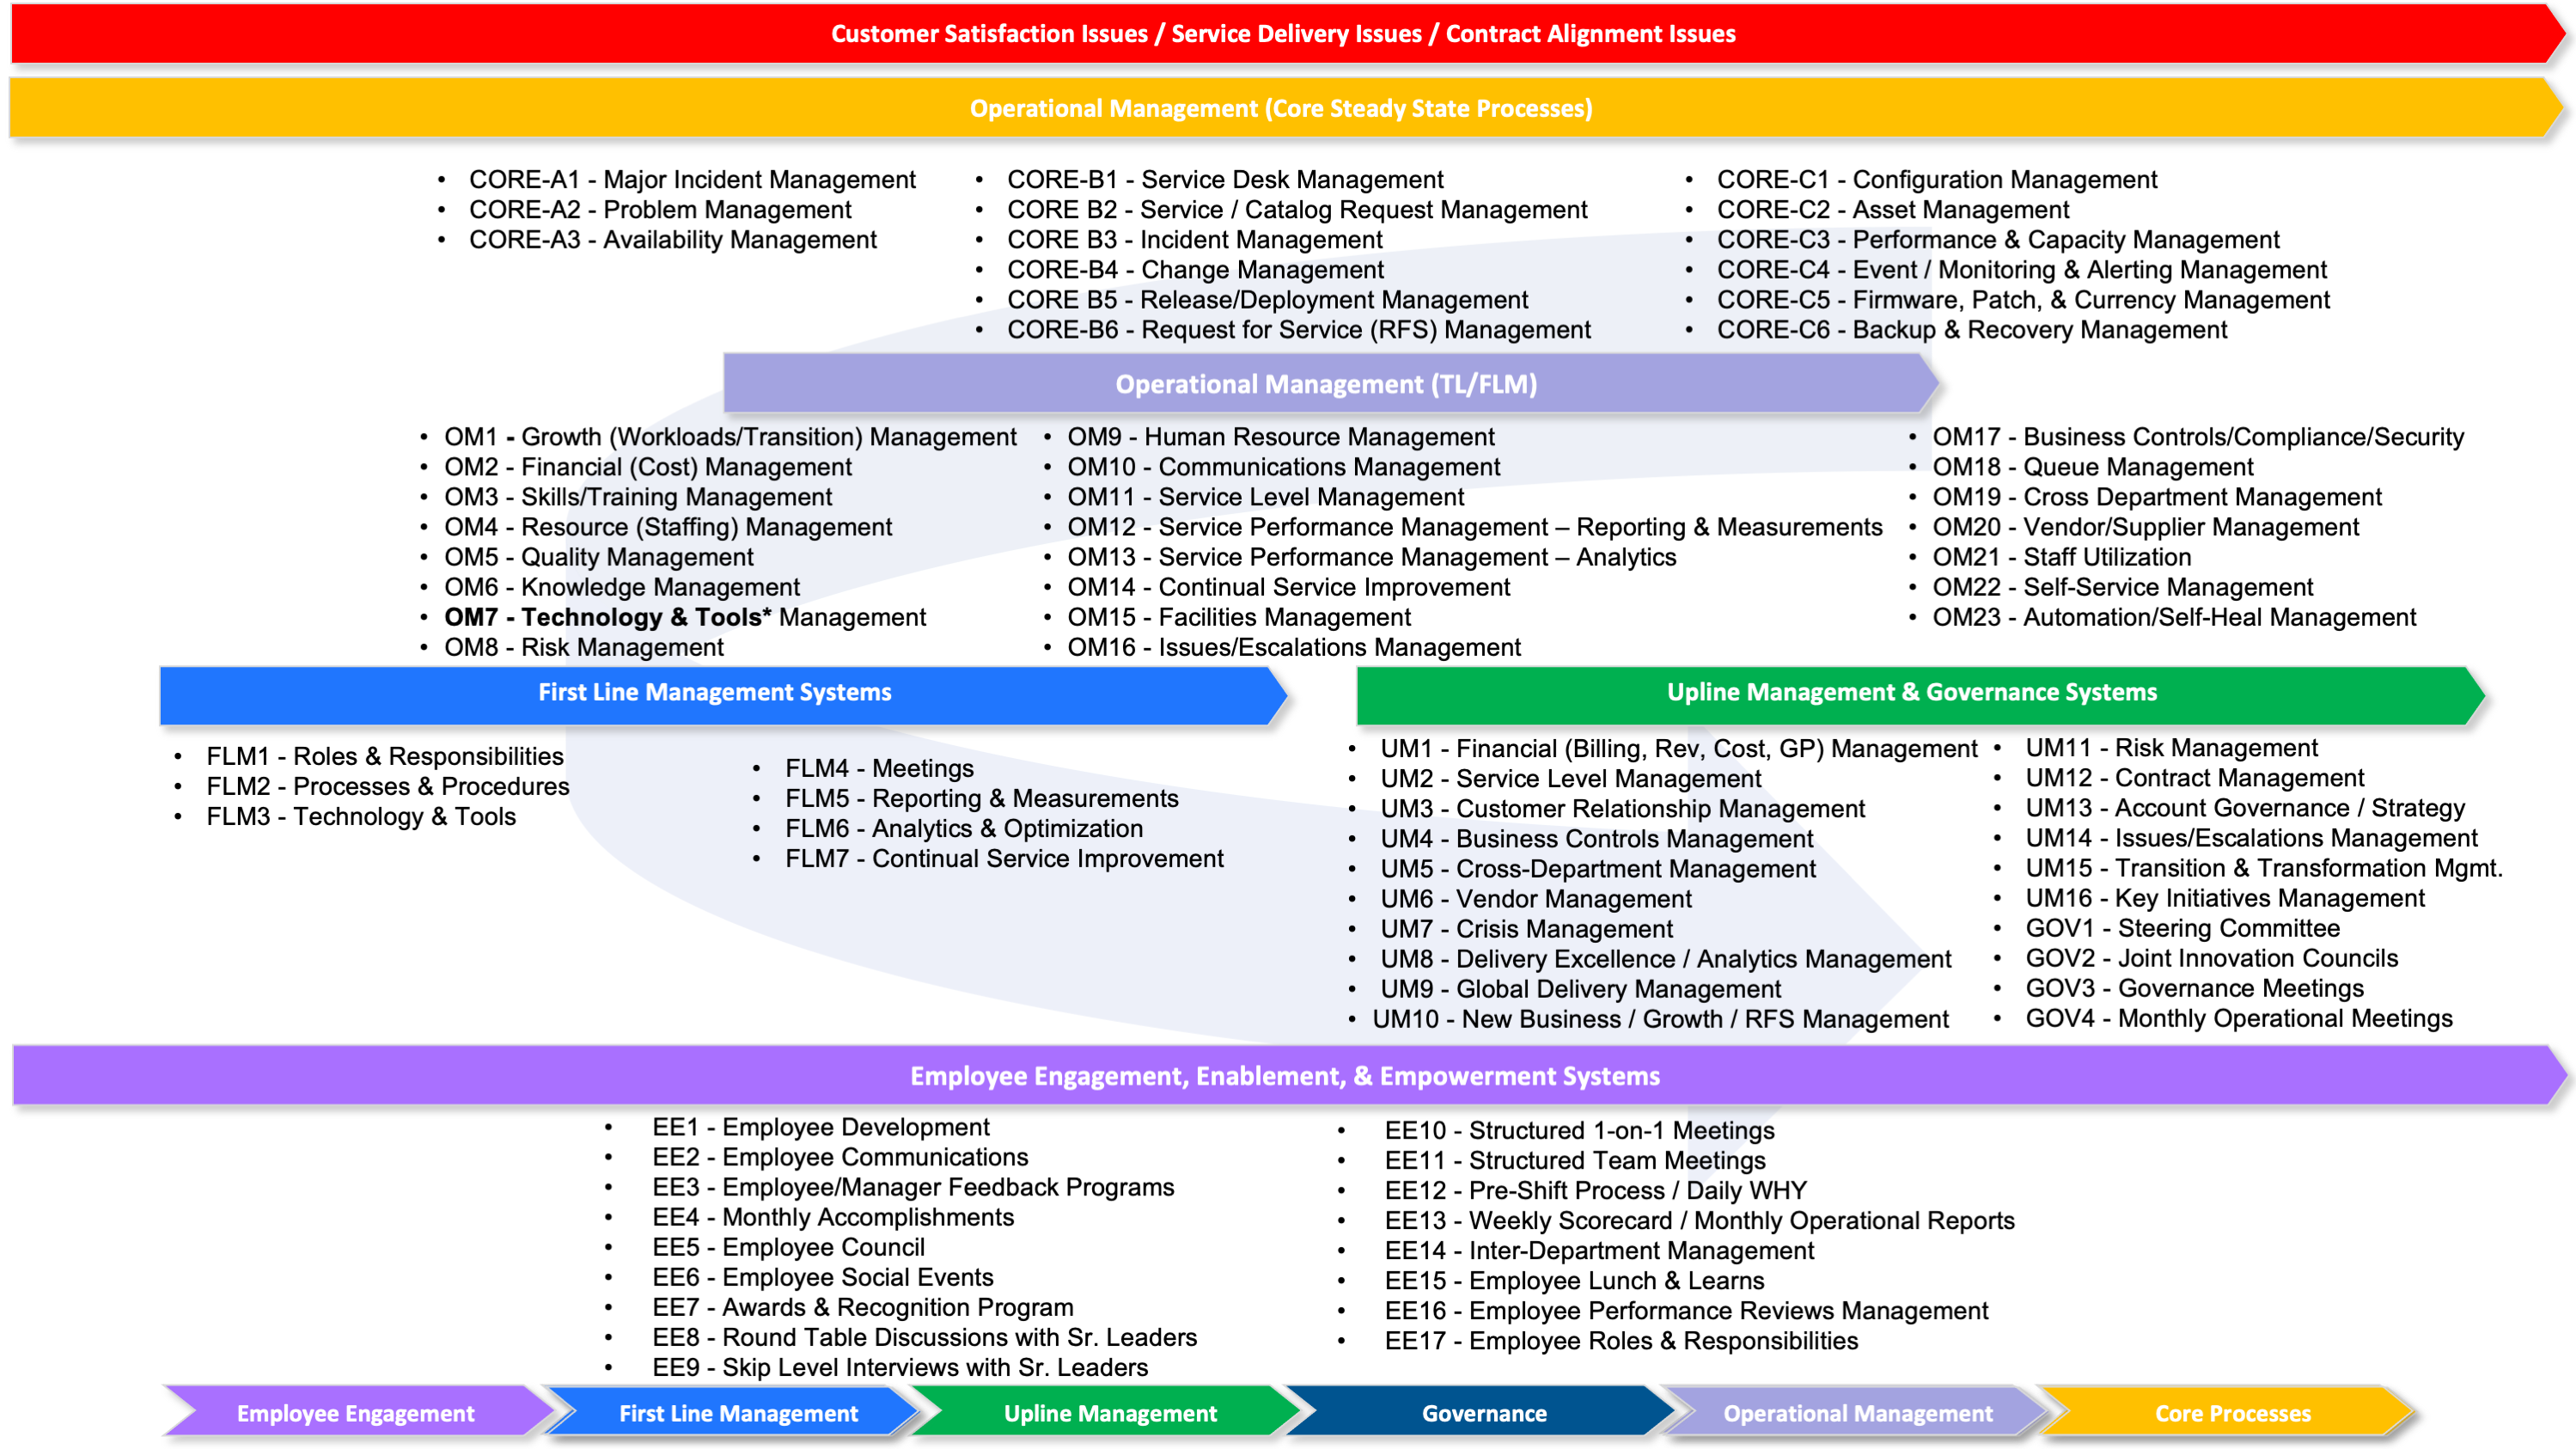
Exercise: What elements of the Operational Management Framework do you think have an impact on Analytics & Optimization?
Subscribe To My Blog To Learn More: https://www.imadlodhi.com/subscribe
Loved it? Follow me.